Debugging and Profiling Java Applications in Kubernetes
Debugging and profiling Java applications running in Kubernetes environments can be a daunting task, often requiring meticulous setup and configuration. In this blog post, we’ll explore efficient strategies to debug and profile Java applications seamlessly within Kubernetes pods. We’ll delve into configuring JVM arguments for debugging, ensuring smooth integration with your favorite IDE, and simplifying the profiling process using tools like Java VisualVM. Whether you’re a seasoned developer or just diving into Kubernetes, this guide will equip you with practical insights to streamline your Java development workflow in Kubernetes environments. Let’s dive in!
Debugging Java Applications in Kubernetes
To effectively debug Java applications, it’s imperative to ensure they’re launched with the correct arguments. To accomplish this, we’ll employ an agent:
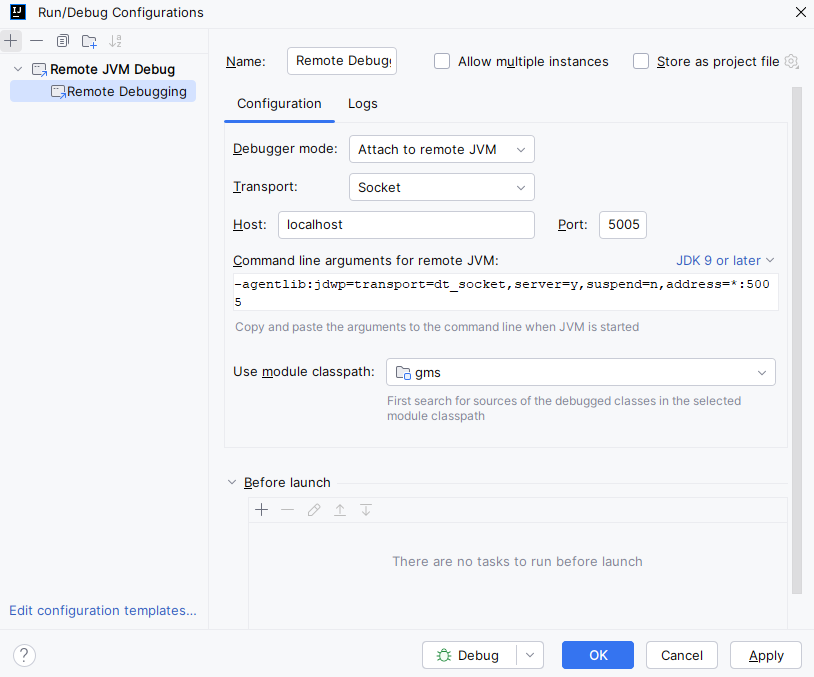
-agentlib:jdwp=transport=dt_socket,server=y,suspend=n,address=*:5005This configuration will open port 5005 on all network interfaces and start the application in non-suspended mode. If you prefer the application to wait until you attach the debugger, set the suspend option to ‘y’.
To ensure these arguments are passed to the JVM reliably, setting the JAVA_OPTS environment variable is recommended. Most Java containers will automatically include this variable in the arguments when invoking the java command. If your setup doesn’t handle this automatically, consider adding it to your startup script for ease of use, as you’ll likely need it frequently.

I find it convenient to adjust the environment variable using tools like k9s instead of directly through the command line or GitOps. This approach sidesteps the need to remember or troubleshoot syntax and avoids waiting for a CI build. Refer to the Kubernetes documentation on where to specify the environment variables. Keep in mind that these changes are ephemeral and should be overwritten by the next CI/CD deployment.
Rather than modifying the pod directly, it’s preferable to modify the parent entity, such as a deployment. This will cause the pods of the deployment to restart with the updated options.
Now, fire up your favorite IDE. For Java development, I prefer IntelliJ. In IntelliJ, you can create a Remote JVM Debug run configuration. Specify localhost and port 5005.
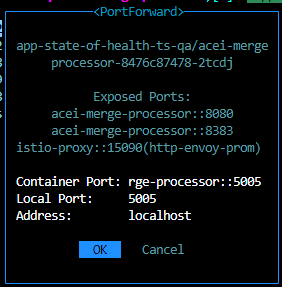
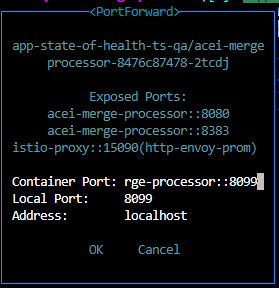
By this point, the pods should have restarted, so it’s time to set up port forwarding. Again, I find k9s convenient for this task (just press shift-f), but you’re free to use kubectl directly.
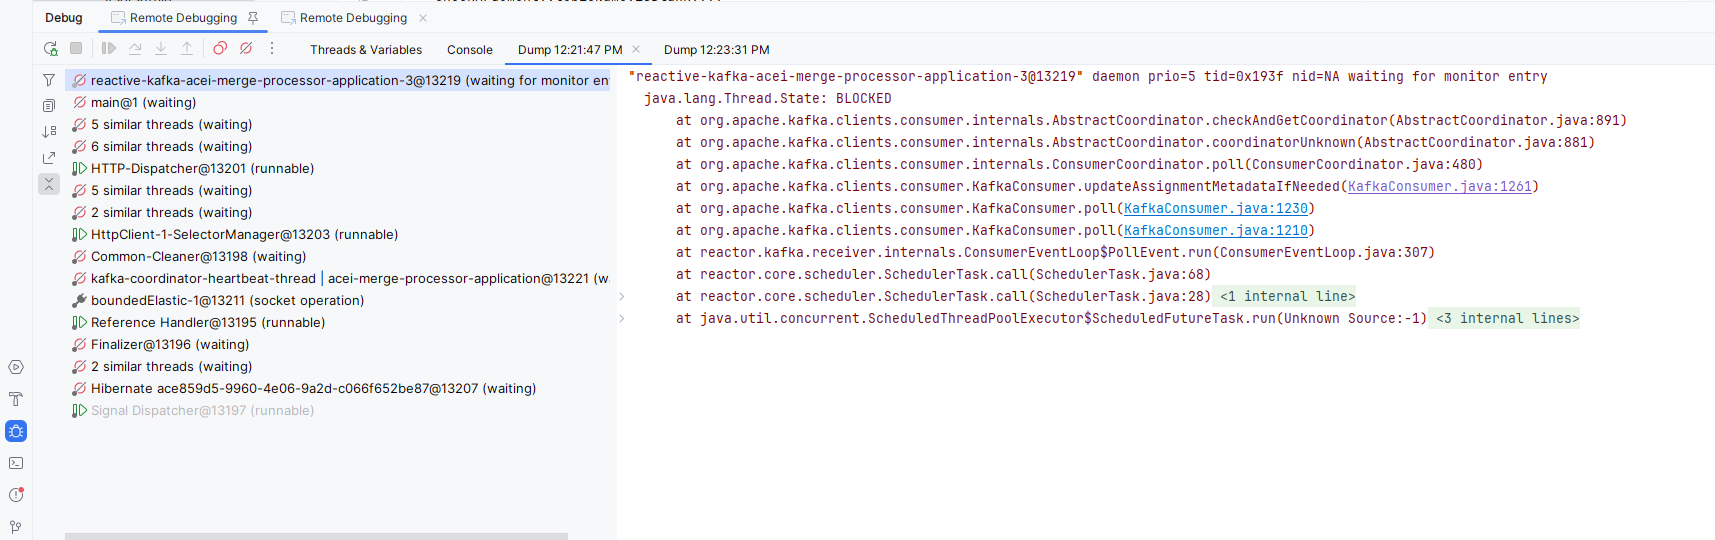
Once the port is forwarded, run the configuration you created. After a few moments, you should see your debug view and be able to pause the VM, set breakpoints, inspect variables, and more.
Profiling Java Applications in Kubernetes
Regrettably, the agent facilitating Java application debugging doesn’t support profiling. To enable profiling, we’ll need to add the following arguments to our JVM:
-Djava.rmi.server.hostname=localhost -Dcom.sun.management.jmxremote -Dcom.sun.management.jmxremote.port=8099 -Dcom.sun.management.jmxremote.rmi.port=8099 -Dcom.sun.management.jmxremote.ssl=false -Dcom.sun.management.jmxremote.authenticate=falseProfiling in our context utilizes JMX, which operates through RMI. This involves a complex forwarding mechanism that can complicate port forwarding setups. To streamline the process and avoid potential issues, we’ll ensure that the RMI port matches the JMX port, simplifying port forwarding to just one port. Additionally, we need to specify localhost as our hostname to ensure the profiler connects properly.
Follow the same procedure as before to add these arguments.
Now, let’s proceed to install Java VisualVM. Ensure that you have the same JVM locally installed as the one running on the pods, then download and run VisualVM. In my experience, VisualVM might not detect the local JVM correctly, so I had to start it with the --jvmhome option:
visualvm.exe --jdkhome %JAVA_HOME%Once the pods have restarted, perform port forwarding as before.
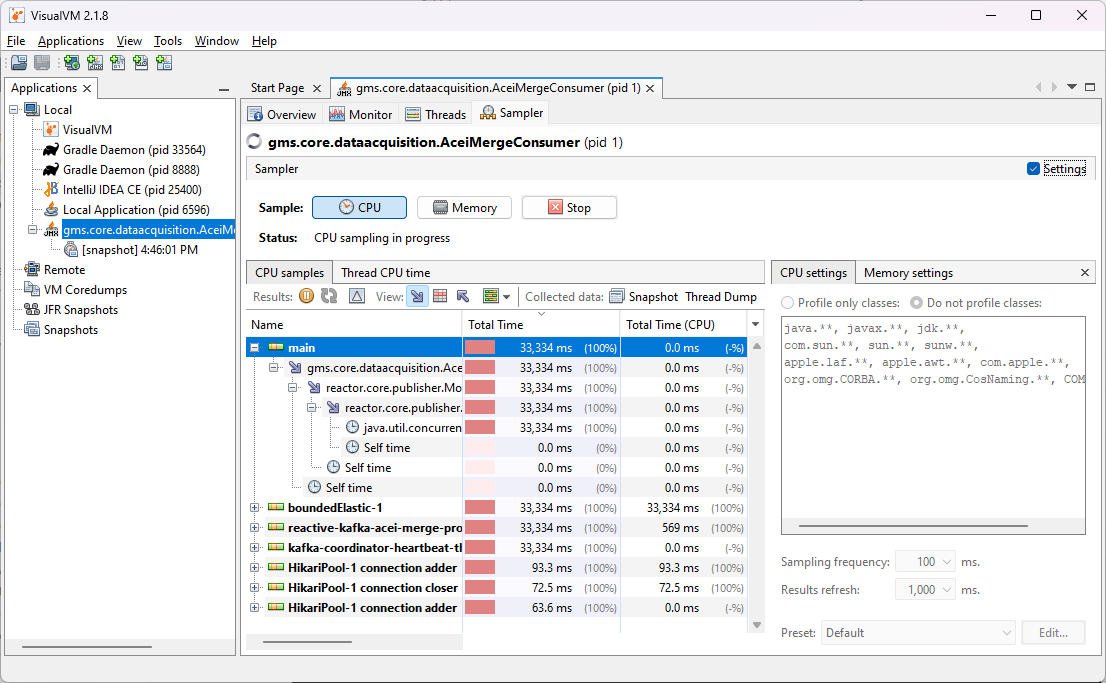
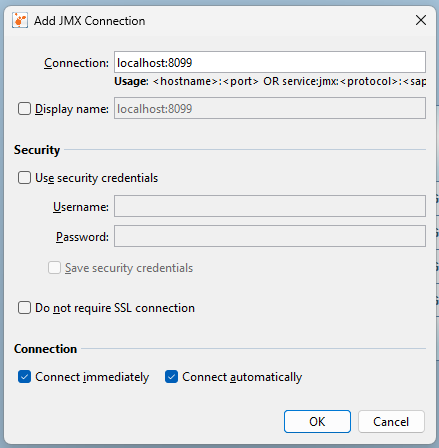
Next, create a new JMX Connection in VisualVM. Ensure that you’re creating a JMX connection, not a Remote Host (which is another method). Specify localhost and port 8099.
Now, you should be able to open the pane for that Java process and observe heap usage, threads, and perform profiling through sampling. The default sampling frequency worked well for me, but you can adjust it based on your bandwidth in the settings.